
Zscaler Digital Experience detects outage
At 7:55 AM PDT on September 15, 2022, Zscaler’s Digital Experience (ZDX) saw a substantial, unexpected drop in the ZDX score for Zoom services across the globe. Upon further analysis, we noticed 502 HTTP Response Code errors highlighting a Zoom outage, with the ZDX heat map clearly detailing the impact at a global scale.
With ZDX, customers can identify service issues and quickly isolate them, giving IT teams confidence in the root cause. This way, any reactive tickets getting opened would already have the resolution, thereby not impacting mean time to resolve (MTTR) and first response time (MTTD).
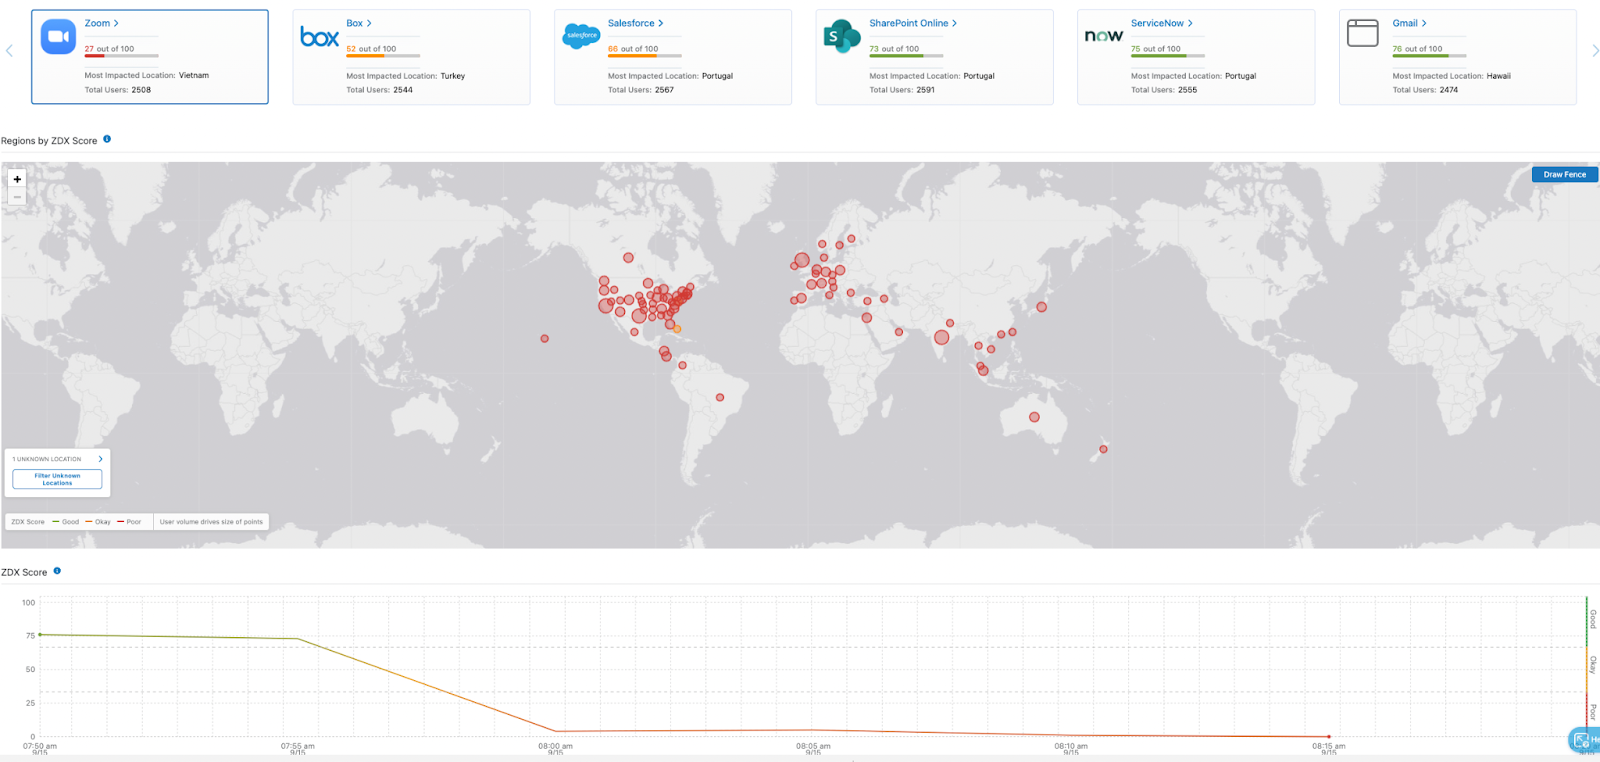
Zscaler’s Digital Experience dashboard showing Zoom global issues
ZDX Score highlights Zoom outage
A ZDX Score represents all users in an organization, across all applications, all locations, and all cities. You can see the score on the ZDX Admin Portal dashboard. Depending on the time period and filters selected within the dashboards, the score will adjust accordingly. The ZDX Score is based on a scale of 1 (lowest) to 100 (highest), with the lowest numbers indicating a poor user experience.
With further analysis, you can see the ZDX Score for the Zoom probes drop to ZERO during the approximate outage of 35 minutes according to ZDX. From within ZDX, service desk teams can easily see that the service degradation isn’t limited to a single location or user and quickly begin analyzing the root cause.

ZDX Score indicating the degradation and recovery times in Zoom
In the ZDX dashboard, you will also see ‘Web Probe Metrics,’ which highlight the impact of reaching Zoom across a timeline with response times. In this case, the server did not respond with 502 errors. A 502 error signifies that a server had an invalid response from another server while acting as a gateway or proxy.
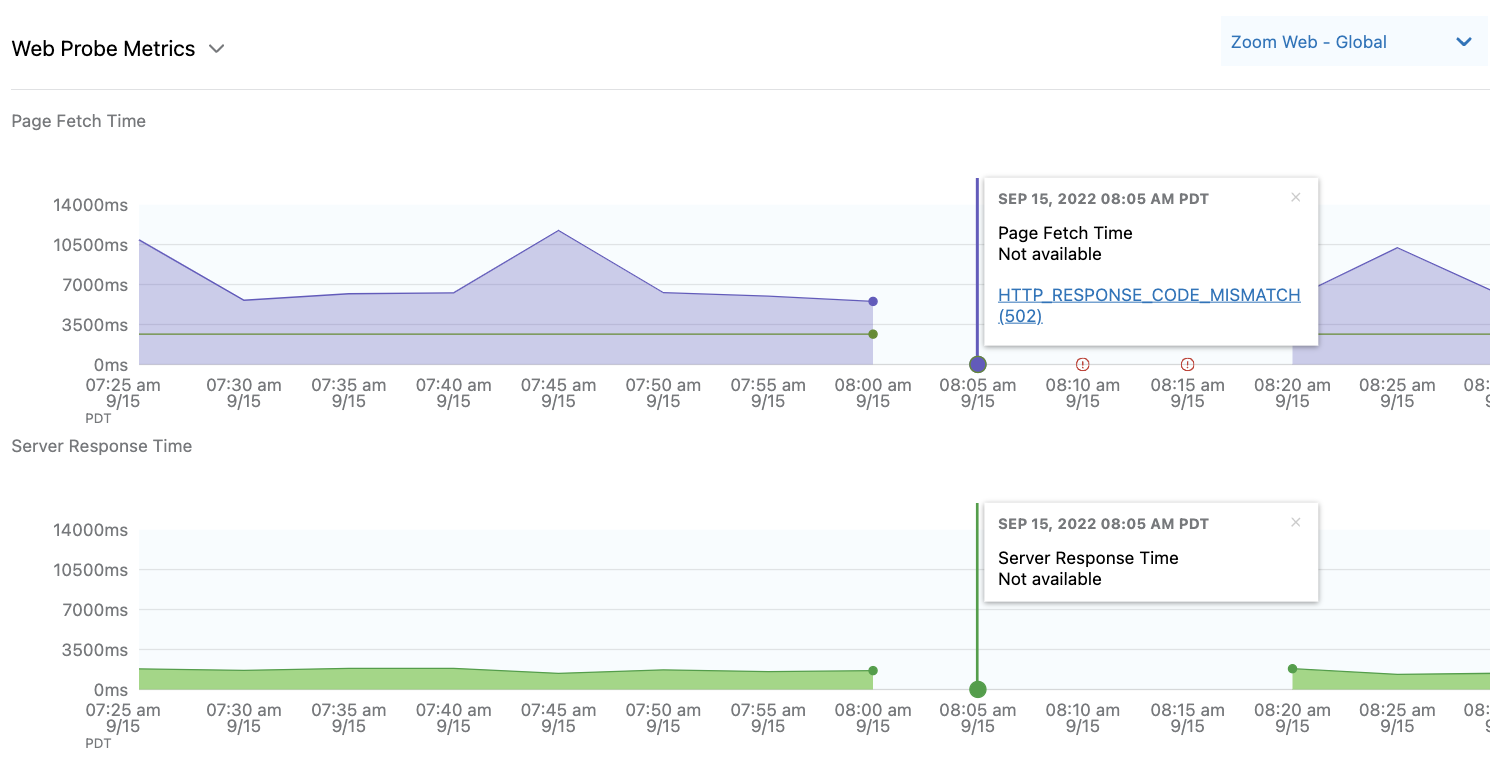
ZDX Web Probe metrics indicating 502 errors
ZDX can quickly identify the root cause of user experience issues with its newly-introduced AI-powered root cause analysis capability. It spares IT teams the labor of sifting through fragmented data and troubleshooting, thereby accelerating resolution and keeping employees productive.
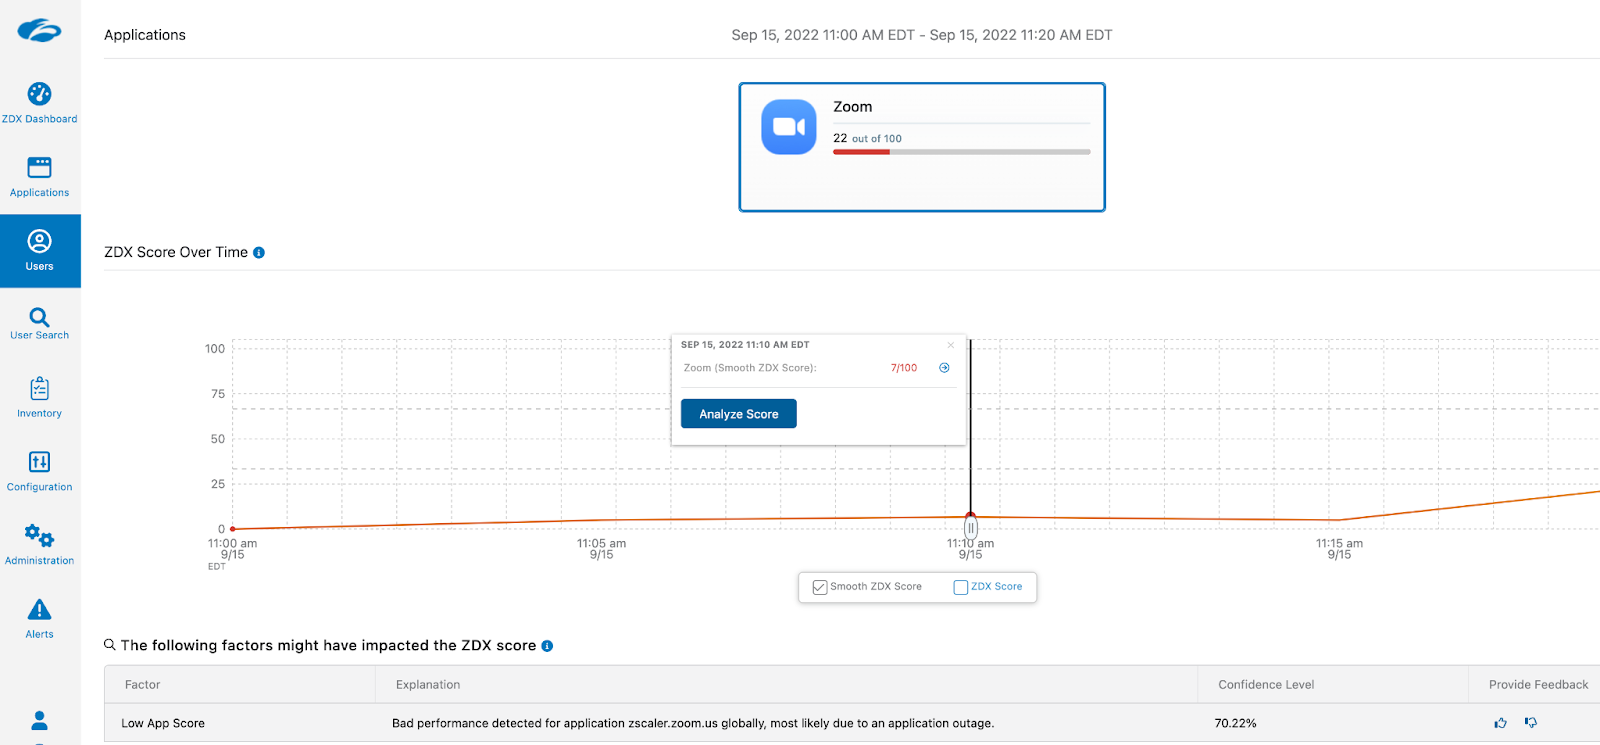
ZDX AI-Powered root cause analysis
With a simple click in the ZDX dashboard, you can analyze a low score, and ZDX will provide you insight as to potential issues. As you can see in the Zoom outage, ZDX highlights the factor as “Low App Score” and reason as “Bad performance detected for application zscaler.zoom.us globally, most likely due to an application outage.”

ZDX AI-Powered root cause analysis indicates the reason for the outage
Whenever there’s an application outage, many IT teams turn to the network as the root cause. However, as you can see above, the ZDX AI-powered root cause analysis already verified that the network transport wasn’t the issue and that it was actually at the application level. You can verify this by looking at the CloudPath metrics from the user to the destination.
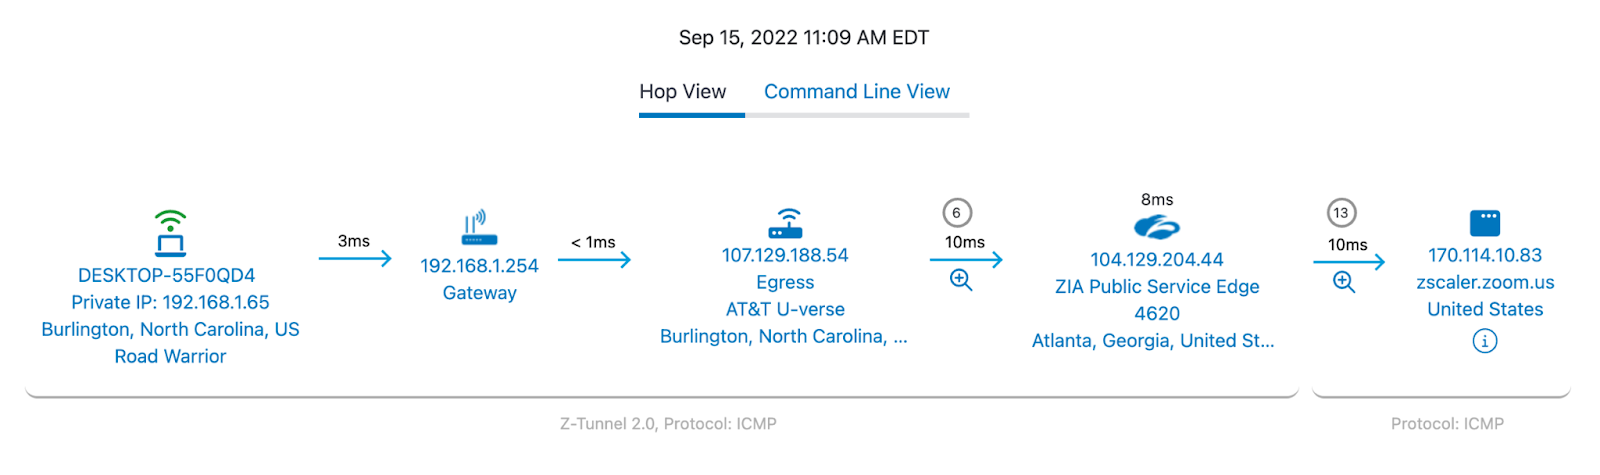
ZDX CloudPath showing end user to destination
As we realize multiple users and geographies are impacted, it’s always a good idea to check if there is an internet service provider (ISP) issue. ZDX Global ISP Insights is an easy-to-leverage site that displays ISP outages across a global map. In this case, you can see that, there’s global ISP issue.

According to Zoom’s status page, the outage was reported at 8:17 AM PDT, and based on ZDX data above, users saw an impact starting at 7:55 AM PDT. However, Zoom services started to recover pretty quickly, by 8:25 AM PDT, and Zoom reported the issue resolved by 8:49 AM PDT.
This was thanks to ZDX, which provided granular insights into user experience without having to rely on SaaS service dashboards. This capability helps service desk teams narrow down outage scale and windows.

Source: Zoom
Zscaler Digital Experience successfully detected a Zoom outage, along with its root cause, giving our customer the confidence it was not a single location, their networks, or devices, averting critical impact to their business.
Try Zscaler Digital Experience today
ZDX helps IT teams monitor digital experiences from the end user perspective to optimize performance and to rapidly fix offending application, network, and device issues. To see how ZDX can help your organization, please contact us.
It's not always the application as the reason for an outage. Join this webinar "Understanding the Root Cause of Common Problems With Your Zoom Call" to learn more.


