Zscalerのブログ
Zscalerの最新ブログ情報を受信
購読する見えないものを把握する - ゼロトラストにおけるパフォーマンス監視
VPN経由でリモートアクセスするプライベートアプリケーションのパフォーマンスをモニタリングすることは、これまで常に課題でした。ユーザとデータセンタ間の暗号化されたトンネルに阻まれて、このネットワーク接続におけるパフォーマンスの問題の原因を解明することはできませんでした。適切な光が当たらないこの暗いトンネルには、頑固な問題の根本原因が隠されていることが多いのです。
これは、VPN管理者にとって悩みの種です。これにより「デスクからは問題ないのに、VPN経由でこのアプリにアクセスすると、本当に遅い」というあまりにも予測可能なサポート依頼が寄せられることとなります。どこからトラブルシューティングを始めれば良いのでしょう。ユーザのデバイスのメモリやCPUの制約かもしれませんし、ローカルWiFiの遅さ、ローカルISPの混雑、バックボーンの問題、データセンタやクラウドホスティング環境の混雑、バックエンドのアプリサーバの遅延のいずれかかもしれません。Zscalerの場合を考えてみましょう。
Zscaler Zero Trust Exchange (ZTE) は、パブリッククラウドやデータセンタ内で実行するプライベートアプリケーションにシームレスなゼロトラストアクセスを提供します。一方、Zscaler Private Access (ZPA) は、アプリケーションが決してインターネットに公開されないようにして、権限のないユーザや従来のモニタリングツールからは完全に見えないようにします。Zscaler Digital Experience (ZDX) とZPAの統合により、内部アプリケーションにアクセスするユーザエクスペリエンスを、アプリケーションとネットワークの両方の視点から理解することが可能になりました。
可視性はゼロトラストの基本です。分からないものは守れません。従来のVPNをZPAに置き換えると、従来のモニタリングツールでは見えない暗いトンネルの領域に、ZDXが明るい光を当てます。
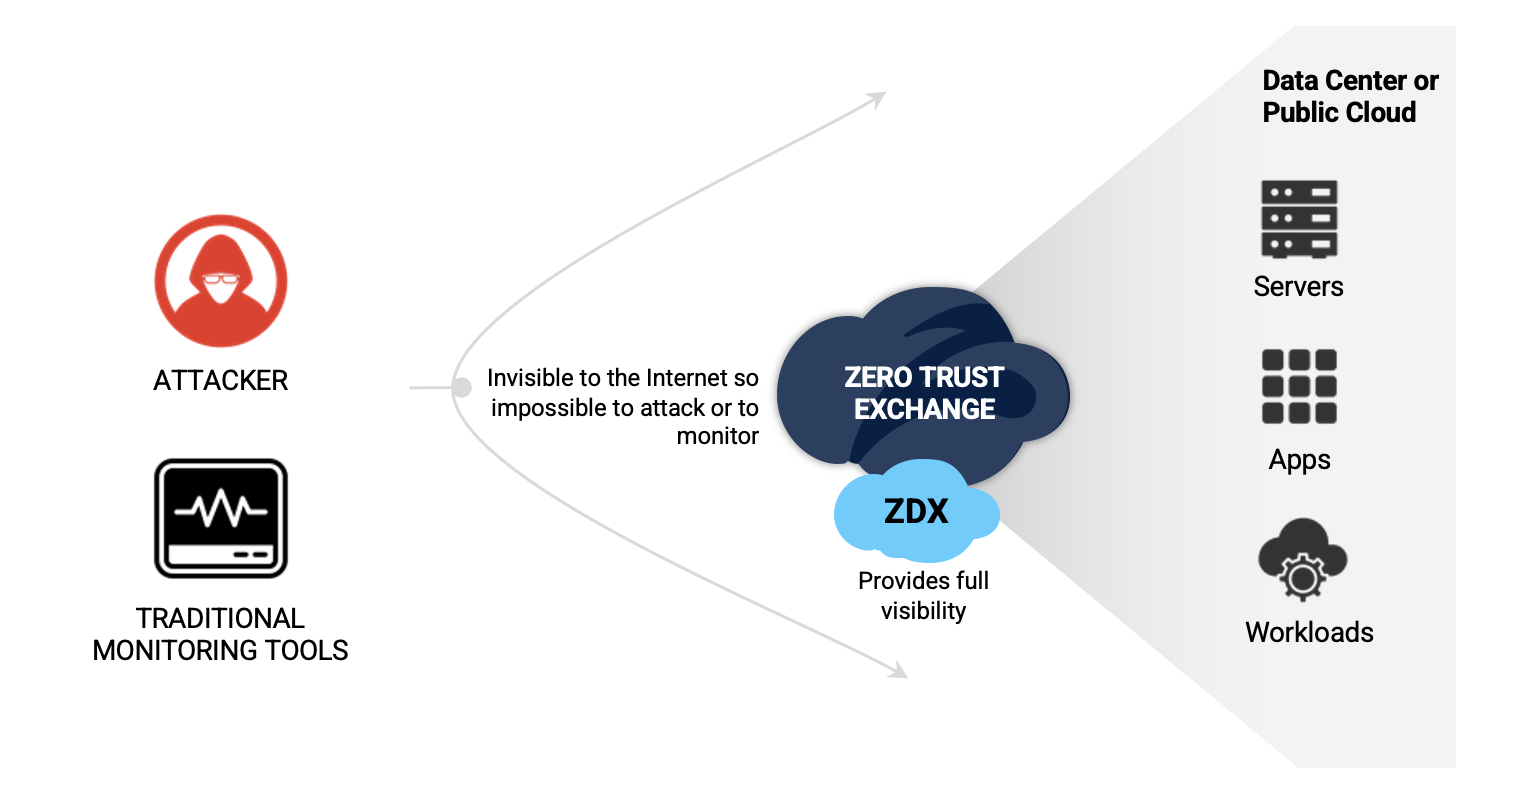
図1:従来のモニタリングツールではプライベートアプリケーションのパフォーマンスをモニタリングできませんが、ZDXは独自の方法で深い可視性を提供
ZDXを使用すると、各従業員のアプリケーション、ネットワークのパフォーマンス、デバイスの健全性に関する統計情報が数分ごとに収集され、プライベート(またはパブリック)アプリケーションについてのユーザエクスペリエンを示すZDXスコアが算出されます。健全性に関するデータは、すべての地域、オフィス、ユーザにわたって集約され、会社全体のパフォーマンスと低下に関するマクロレベルの可視性を提供します。
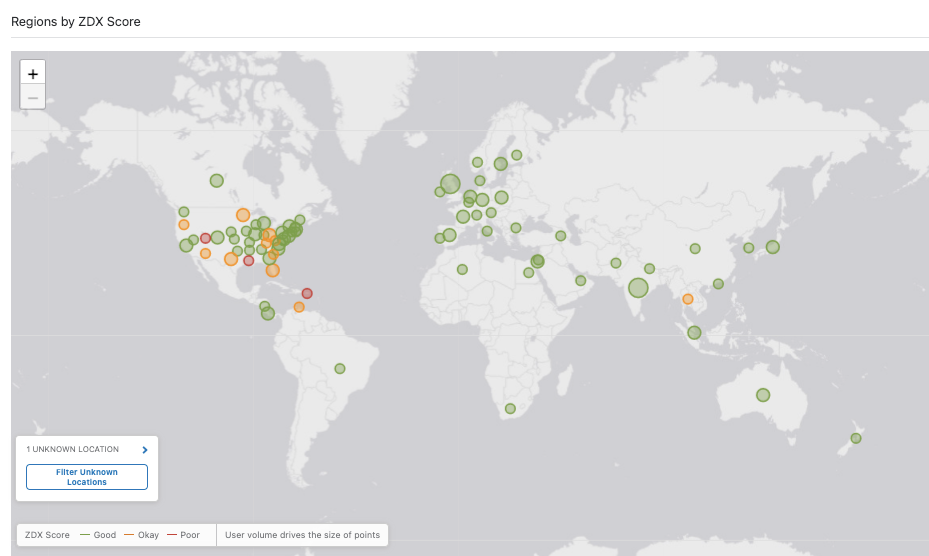
図2:ZDXは、個々のユーザーのZDXスコアを計算することで、パブリックアプリケーションとプライベートアプリケーションの両方のパフォーマンスを表示
このZDXスコアと、CloudPathを使ったホップごとのネットワークパス解析を組み合わせることで、セグメントごとの遅延と損失の内訳が提供され、パフォーマンス低下に対するネットワークの影響を容易に分離します(図3参照)。
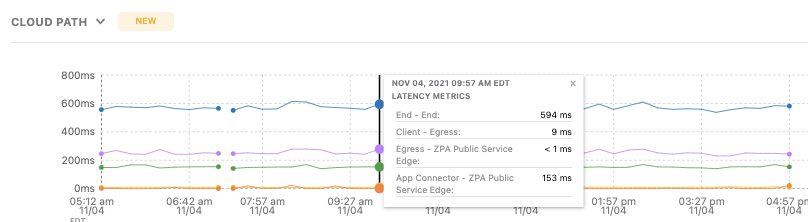
図3:CloudPathは、プライベートとパブリックの両方のアプリケーションについて、すべての従業員から数分ごとにセグメントの遅延を算出
CloudPathでは、ZscalerのClient ConnectorエージェントとZero Trust Exchangeの統合を活用して、ネットワークパフォーマンスを測定します。これにより、CloudPathはZDXのユニークな360度モニタリングを利用することができます(詳しくは最新のブログをご覧ください)。ネットワークパス分析は、クライアントのエンドポイントから、アウトバウンドで行われ、また、Zscalerクラウドを活用して、Zscalerクラウドからのインバウンドのネットワークパスを見ることができます。App Connectorのホップを含むZscalerのクラウドとプライベートアプリケーション間のネットワークパスを、これに組み合わせます。要するに、CloudPathはこれらのパストレースをつなぎ合わせることで、ネットワークパスのエンドツーエンドのビューを作成します(図4を参照)。

図4:ZDXが、ZPAで保護された内部アプリケーションのホップごとのネットワークの詳細を公開
ZDXは、ユーザのデバイス、ゲートウェイ、およびISPへの接続間のホップとネットワークの詳細を公開します。こうしたホップは、従来のモニタリングツールやVPN環境では見えません。
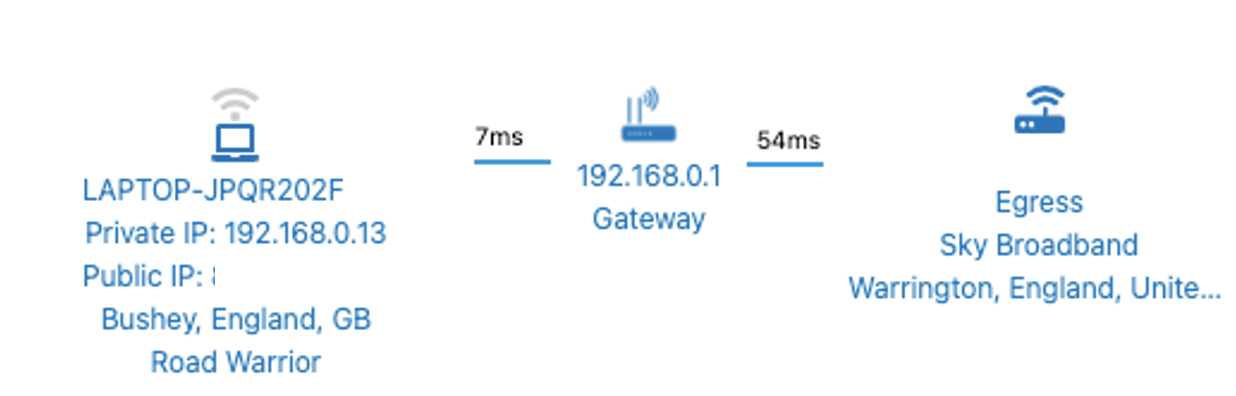
図 5: ZDXはユーザデバイス、ゲートウェイおよびISP間の接続を表示
また、ZDXはユーザのISPとZscalerクラウド間の各ホップを識別し、プライベートアプリケーショントラフィックがどのバックボーンプロバイダを通して接続しているか示します。
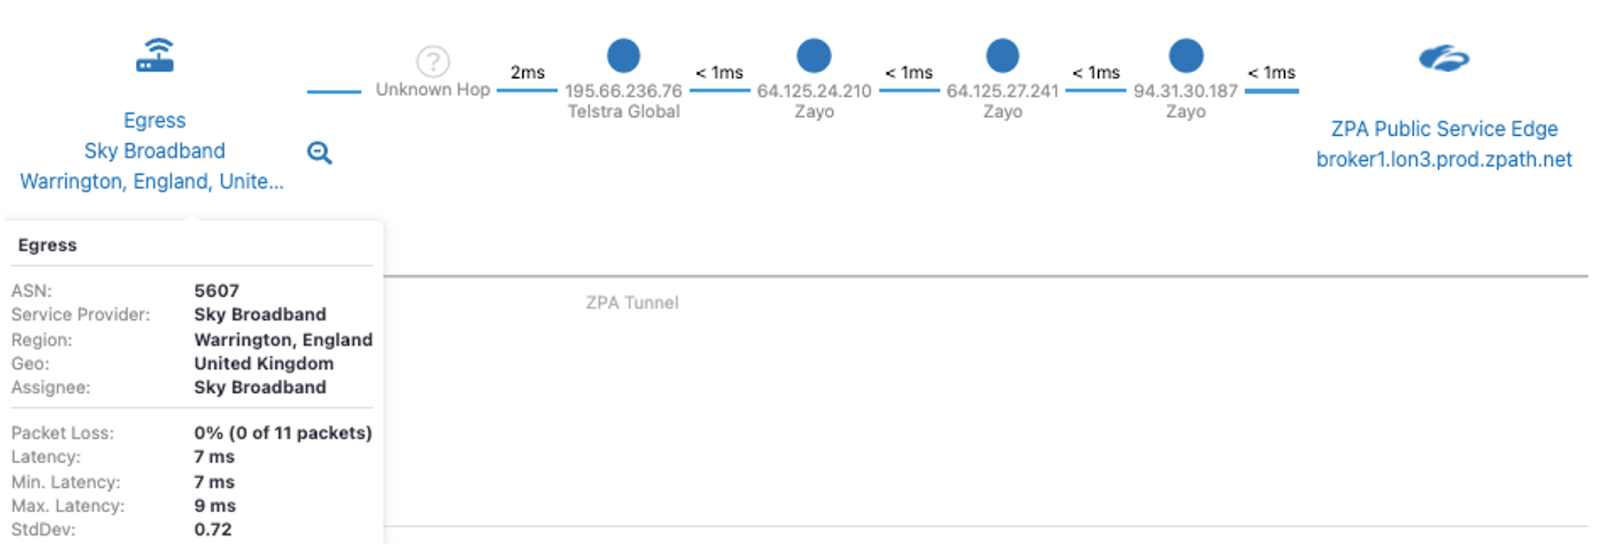
図6:ユーザのISPとZscalerのZPA Public Service Edge間の接続
Zscaler Private Accessは、App Connectorを使用してプライベートアプリケーションへのゼロトラストアクセスを提供します。App Connectorは、お客様のサーバとZPAクラウド間の安全な認証インターフェースを提供します。ZDXは、ZPA Public Service EdgeとApp Connector間のネットワークホップと、パス上の異常な遅延ホップを強調します。

図7:ZPA Public Service EdgeとApp Connector間の接続を調べる
最後に、ZDXはApp Connectorとプライベートアプリケーション間のホップと遅延の詳細を提供することができます。通常、App Connectorはアプリケーションホストのすぐ近くにデプロイされますが、図8に示されるように、そうではない場合もあります。

図8:App Connectorとアプリケーションホスト間の接続を見る
手間のかかるサポートチケットの問題に対処するために必要なツールがようやく手に入り、アプリケーションへのアクセスがオンプレミスでは問題なく動作するのに、リモートユーザにとってが遅い理由を正確に特定できるようになりました。ZDXとZPAの連携で、ゼロトラストの環境に明るい光を当てて、見えなかったものを照らします。
続きを読む:
高速でシームレスなデジタルエクスペリエンス – コラボレーションアプリでの利用も可能にするZDX SH


