
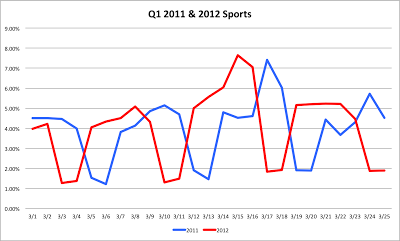
3/26 Update: I was approached and asked to run stats to do a bit of comparison and contrast with Sports traffic from last year - with the goal in mind to identify if there was a noticeable percentage increase in Sports (March Madness) this year compared to last year. There was a two day difference from March 2011 to 2012 for the tournament dates - these are noticeable in the tracked stats. The data shows only a slight increase (<1%) in March Madness traffic this year compared to last year - in general this appears to be a fairly static and expected event within Enterprise traffic.


With the Super Bowl in early February and the NCAA basketball tournament ("March Madness") sports are a major focus of attention in Quarter 1. That means a lot of bandwidth consumed by the enterprise and time spent by employees on this subject. One report calculated that an estimated $1.7B is to be lost in productivity at the office during this March Madness. Even if sports are not your thing, you may find yourself participating in an office pool surrounding the Super Bowl or March Madness. When I was filling out my bracket this year, I found myself on some "gambling" web-sites to do some quick research on team odds in the tournament (not that it helped my bracket any). I was curious how much bandwidth we saw across our enterprise customers related to sports and gambling for these major Q1 sporting events and to also see if there was any correlation. For those interested in tracking this subject, here are my findings from our large, diverse, enterprise customers:

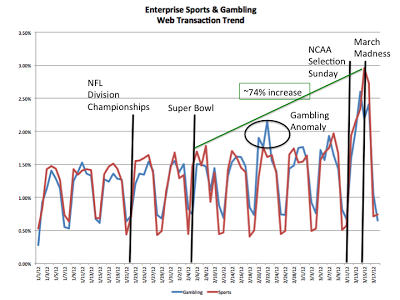
The above blue line represents gambling traffic as a percentage of its total seen thus far for the quarter, and the red line is sports traffic as a percentage of its total seen thus far for the quarter. The cyclic nature of our data-set is because this is from our enterprise customers -many of which have less employees working on weekends. (Date periods are related to PST time)
There were not large noticeable spikes in sports or gambling traffic observed in the enterprise during the NFL playoffs or Super Bowl - likely due to the fact that the NFL games are on the weekend and toward the end of the season may have a more regional versus global fan base.
However, there was a very noticeable increase in traffic surrounding March Madness - particularly during the 2nd round of games, several of which are televised during US work hours. Specifically the start of March Madness had about a 74% increase in sports related traffic from the Super Bowl.
Throughout our Q1 data-set we see that gambling closely follows the traffic patterns related to sports. In the case of the noticeable spike in sports traffic, we see a similar related pattern increases in gambling traffic. One major exception related to gambling was the period of Feb 20 -22. While most of the baseline gambling traffic are online casinos and gambling affiliates -- looking more closely at the website paths visited related to gambling within this period determined that this anomaly was caused due to the ICC Cricket World Cup in which many of our Australian and Indian customers were following the games.
Chances are that traffic from your enterprise participated in one or more of these events during this Q1.


