We have received several requests inquiring as to the changes in enterprise Internet activity in the regions impacted by Hurricane Sandy. There is no question that the hurricane impacted the US in a variety of ways. Zscaler provides security and policy enforcement for web and email network traffic for Enterprise users, while in the office or working remotely. Given the role that Zscaler plays, we are able to do regional traffic comparisons from enterprises from last Monday/Tuesday ("normal") with this Monday/Tuesday (impacted by hurricane). Enterprise web traffic can be seen as one measure of economic productivity.
Region: Washington D.C.
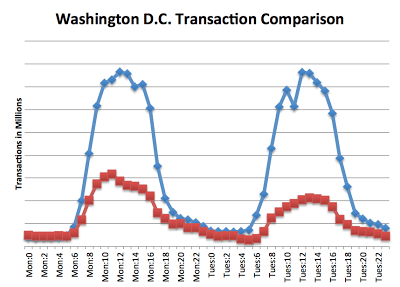
Zscaler has regional nodes in and around the Washington D.C. area to service regional customers and road-warriors in the area. The following details the transactions per hour from last week (in blue) compared with those from this week (in red):

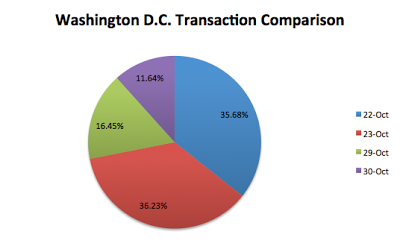
The two blue spikes on the chart correspond to the workdays last Monday and Tuesday (beginning around 6AM and ending around 7PM local time). The two small red humps correspond to the workday traffic observed this week during Hurricane Sandy. It is immediately apparent that there was a significant decline in the transactions from Enterprise customers during the hurricane. More specifically, we observed an average decline of 60.93% in transactions from the previous week. Another view of this data can be seen in the following pie chart showing the percentage breakdown of transactions across the dates being compared.
Region: New York City / New York
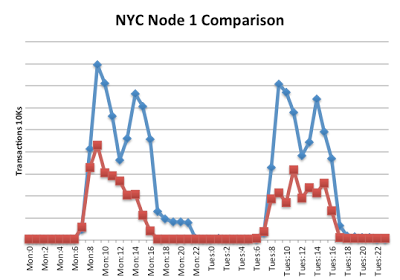
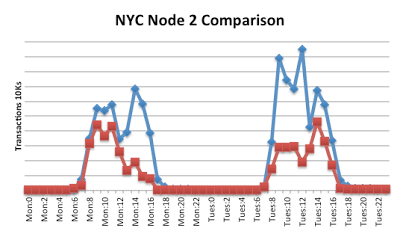
As with Washington D.C., Zscaler has multiple nodes in the New York area to support regional customers and road-warriors in the area. The following charts provide a similar comparison to that previously listed in the Washington D.C. region. The blue line represents transactions serviced last Monday/Tuesday and the red lines from this week, impacted by Sandy. To provide a little different illustration - we have selected two New York nodes to provide a more granular comparison of traffic across the two weeks.
The New York node 1 had an average decrease of 58.14% from the previous week, and node 2 had an average decrease of 52.31%.
In the wake of Hurricane Sandy we observed specific regional declines in traffic from our enterprise customers. From the specific regions / nodes analyzed here, there was an average decline of 57.13% in web transaction from last week (normal customer activity) to this week (hurricane impact). Enterprise traffic could be seen as one measure of economic productivity.